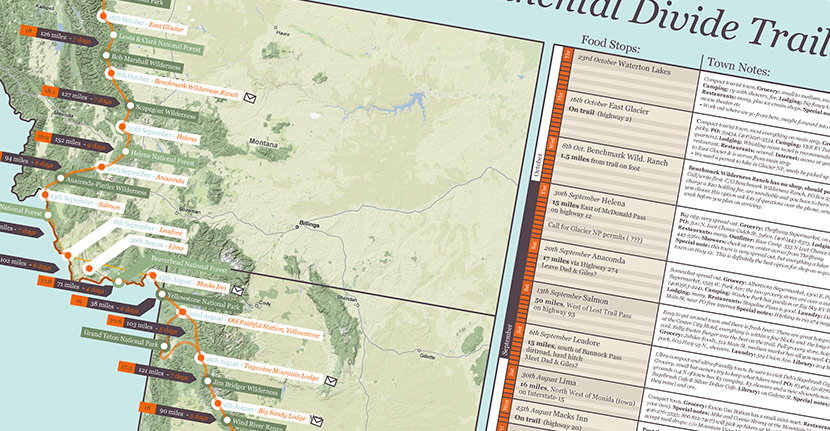
Client: Personal | Click for larger view
This is an infographic of my 3000 mile route across America on the Continental Divide Trail, due to start walking in May 2008! I produced this to get my head round the basic logistics – The white markers are towns we’ll be passing through to get supplies, with the dates we’re hoping to get there. The black & orange arrows indicate how many miles there are in between each town, how many days I expect it will take us to cover the distance and the average daily distance we need to do to get there on time. It looks deceptively simple, but this took me hours and hours to work out, and went through many many revisions!


Good to see you can get some pie after just a couple of weeks. Pity you have to wait until September for some tasty fish.